
Distributed Tracing with Open Telemetry
Permalink
Recently, I have been working with Open Telemetry tracing at work, namely on adding tracing support to multiple web services in order to understand where time is being spent. Since it has been quite an interesting experience, I decided it could be a great idea to write about it, with a tiny demo.
Essentially, Open Telemetry (OTel) is a framework for observability,
that is, specifications and tools that help you to generate and capture telemetry data.
There are implementations in different languages, but today I will be exemplifying how to add
OTel to a Go application with opentelemetry-go.
For this demo, we will be creating two different web services that talk to each other: (a) the reversing service, which will take an HTTP request body, reverse it, and send that back; and (b) the forwarding service, which will take data from the URL query and forward it to the reversing service as request body, and forward back the response. This will allow us to see how the tracing works across multiple services.
✨ Common Helpers
Before building each of the services, we will first create a simple common package that will provide some helper functions for both of them. This helper functions will take care of creating a tracer provider, which contains the places to which the tracing data is exported, and the general set-up of tracing.
For this example, we will be using Jaeger as the exporter.
However, it is good practice to use the exporters defined by the available environment variables,
as per the specification. Sadly, opentelemetry-go does not support that natively. At work,
we have created a helper function that parses the environment variables and returns the correct exporter.
So let’s start by creating a common package, common, where we will first create
a helper function to generate a tracer provider:
import (
	"context"
	"fmt"

	"go.opentelemetry.io/otel/exporters/jaeger"
	"go.opentelemetry.io/otel/sdk/resource"
	"go.opentelemetry.io/otel/sdk/trace"
	semconv "go.opentelemetry.io/otel/semconv/v1.4.0"
)

func NewTracerProvider(serviceName string) (*trace.TracerProvider, error) {
	// Creates the Jaeger exporter with the default configuration.
	exporter, err := jaeger.New(jaeger.WithCollectorEndpoint())
	if err != nil {
		return nil, fmt.Errorf("building Jaeger exporter: %w", err)
	}

	options := []trace.TracerProviderOption{
		trace.WithBatcher(exporter),
	}

	// Creates some basic options with the service name.
	r, err := resource.Merge(
		resource.Default(),
		resource.NewSchemaless(
			semconv.ServiceNameKey.String(serviceName),
		),
	)
	if err != nil {
		return nil, err
	}
	options = append(options, trace.WithResource(r))

	// Effectively creates the tracer provider.
	return trace.NewTracerProvider(options...), nil
}
In the same file, we will create a helper function to setup tracing globally in
the caller’s package. This function, called SetupTracing, takes the service name
to be used in the tracer provider. Check the remaining inline comments to see
what each function does.
import (
	"go.opentelemetry.io/contrib/propagators/autoprop"
	"go.opentelemetry.io/otel"
)

func SetupTracing(serviceName string) error {
	tp, err := NewTracerProvider(serviceName)
	if err != nil {
		return err
	}

	// Sets the default trace provider for this process. If this is not done, tracing
	// will not be enabled. Please note that this will apply to the entire process
	// as it is set as the default tracer, as per OTel recommendations.
	otel.SetTracerProvider(tp)

	// Configures the default propagators used by the Open Telemetry library. By
	// using autoprop.NewTextMapPropagator, we ensure the value of the environmental
	// variable OTEL_PROPAGATORS is respected, if set. By default, Trace Context
	// and Baggage are used. More details on:
	// https://github.com/open-telemetry/opentelemetry-specification/blob/main/specification/sdk-environment-variables.md
	otel.SetTextMapPropagator(autoprop.NewTextMapPropagator())

	return nil
}
🐐 Reversing Service
Now, let’s build the reversing service. The reversing service is very simple. We have
an HTTP handler that takes a request, reads the body, reverses it, and sends it back.
Let’s start by defining reverse, the function that takes care of actually reversing
a string. For simplicity, we define it recursively.
import (
	"context"

	"go.opentelemetry.io/otel"
)

var tracer = otel.Tracer("reverse-microservice")

func reverse(ctx context.Context, str string) string {
	ctx, span := tracer.Start(ctx, "Reverse Function")
	defer span.End()

	if str == "" {
		return ""
	}
	runes := []rune(str)
	return reverse(ctx, string(runes[1:])) + string(runes[0])
}
As you can see, we created a tracer that is used to create a span. When we create
a tracing span, it will be visible in the tracing logs. We could’ve added more information
via the options, such as the string to be reversed, and then it would also be available
in the logs. For more information, check the documentation of tracer.Start.
Now, we define our simple HTTP handler, reverseHandler that gets a request body,
reads it, and reverses it. Quite simple.
import (
	"io"
	"net/http"
)

func reverseHandler() http.Handler {
	return http.HandlerFunc(func(w http.ResponseWriter, r *http.Request) {
		body, err := io.ReadAll(r.Body)
		if err != nil {
			http.Error(w, err.Error(), http.StatusInternalServerError)
			return
		}

		str := reverse(r.Context(), string(body))
		_, _ = w.Write([]byte(str))
	})
}
Finally, we put all together under the main function. Here, we setup the tracing
using the functions defined in the common package. We proceed to create the
HTTP handler, and wrapping it with otelhttp.NewHandler. By doing so, we ensure
the tracing information in the headers is honoured. In addition, the tracing information
will be injected into the request’s context.
package main

import (
	"io"
	"log"
	"net/http"
	"otel-demo/common"

	"go.opentelemetry.io/contrib/instrumentation/net/http/otelhttp"
)

func main() {
	common.SetupTracing("Reverse Microservice")
	handler := reverseHandler()
	handler = otelhttp.NewHandler(handler, "Reverse Handler")
	err := http.ListenAndServe(":8081", handler)
	if err != nil {
		log.Fatal(err)
	}
}
⏭️ Forwarding Service
On the side of the forwarding service, things look quite similar. We set up the tracing,
create a handler and wrap it with the OTel HTTP handler. Our handler here takes the
string in the text query parameter and forwards it to the reversing service.
package main

import (
	"context"
	"io"
	"log"
	"net/http"
	"otel-demo/common"
	"strings"

	"go.opentelemetry.io/contrib/instrumentation/net/http/otelhttp"
)

func main() {
	common.SetupTracing("Forwarding Microservice")

	handler := contactReverseHandler("http://127.0.0.1:8081/")
	handler = otelhttp.NewHandler(handler, "Forwarding Handler")

	err := http.ListenAndServe(":8080", handler)
	if err != nil {
		log.Fatal(err)
	}
}

func contactReverseHandler(endpoint string) http.Handler {
	httpClient := &http.Client{
		Transport: otelhttp.NewTransport(http.DefaultTransport),
	}

	return http.HandlerFunc(func(w http.ResponseWriter, r *http.Request) {
		query := r.URL.Query().Get("text")
		if query == "" {
			http.Error(w, "query text is empty", http.StatusBadRequest)
			return
		}

		req, err := http.NewRequestWithContext(r.Context(), http.MethodGet, endpoint, strings.NewReader(query))
		if err != nil {
			http.Error(w, err.Error(), http.StatusInternalServerError)
			return
		}

		res, err := httpClient.Do(req)
		if err != nil {
			http.Error(w, err.Error(), http.StatusInternalServerError)
			return
		}

		_, _ = io.Copy(w, res.Body)
	})
}
The most important part to note here is the usage of the custom http.Client with the
otelhttp.Transport. This transport will ensure that the tracing information in the context,
such as the tracing ID, is forwarded to the requests using the propagators defined beforehand,
which, by default, are Baggage and Trace Context.
👅 Trying It Out
Now that we have both services’ code written, we just have to execute them. As mentioned before, we are using Jaeger as the target service to collect the telemetry data. Therefore, we need to start a Jaeger instance. To do so, we can simply run the following Docker command, which will start the “all in one” Jaeger installation.
$ docker run --rm -it --name jaeger \
  -e COLLECTOR_ZIPKIN_HOST_PORT=:9411 \
  -p 5775:5775/udp \
  -p 6831:6831/udp \
  -p 6832:6832/udp \
  -p 5778:5778 \
  -p 16686:16686 \
  -p 14268:14268 \
  -p 14269:14269 \
  -p 14250:14250 \
  -p 9411:9411 \
  jaegertracing/all-in-one
Jaeger’s UI can be now found at http://localhost:16686. There, you will be able to inspect
the traces you’ve gotten. If you now make a request to the forwarding service (as below),
you will then be able to see the trace in Jaeger. In this trace, it will show the spans
from the functions we’ve created as well as the services and handlers it went through.
$ curl "http://127.0.0.1:8080/?text=capybara"
arabypac
Now, you may notice that the trace ID is not that descriptive. In a service where you have thousands of requests, how do you find the one that you are looking for? Well, there are many ways. However, if you are looking to inspect the trace of a specific request you are making, you can generate your own trace identifier.
By default, OTel is using Baggage and Trace Context,
which are two specifications that allow us to pass down tracing information through
multiple services. As seen in the Trace Context, the traceparent HTTP header
is formed as follows:
version-format   = trace-id "-" parent-id "-" trace-flags
trace-id         = 32HEXDIGLC  ; 16 bytes array identifier. All zeroes forbidden
parent-id        = 16HEXDIGLC  ; 8 bytes array identifier. All zeroes forbidden
trace-flags      = 2HEXDIGLC   ; 8 bit flags. Currently, only one bit is used.
As you might be thinking, this doesn’t seem that hard to generate. And that’s what
we will do. The following commands generate and print a traceparent for us, and
then passes it onto the request.
$ trace_id="$(cat /dev/urandom | gtr -dc 'a-f0-9' | fold -w 32 | head -n 1)"
$ parent_id="00$(cat /dev/urandom | gtr -dc 'a-f0-9' | fold -w 14 | head -n 1)"
$ trace_parent="00-$trace_id-$parent_id-01"
$ echo $trace_parent
00-8ef0da10cfb0183cdf8fcbe89b778bf6-0040a998f29eaaa3-01
$ curl -H "Traceparent: $trace_parent" "http://127.0.0.1:8080/?text=capybara"
arabypac
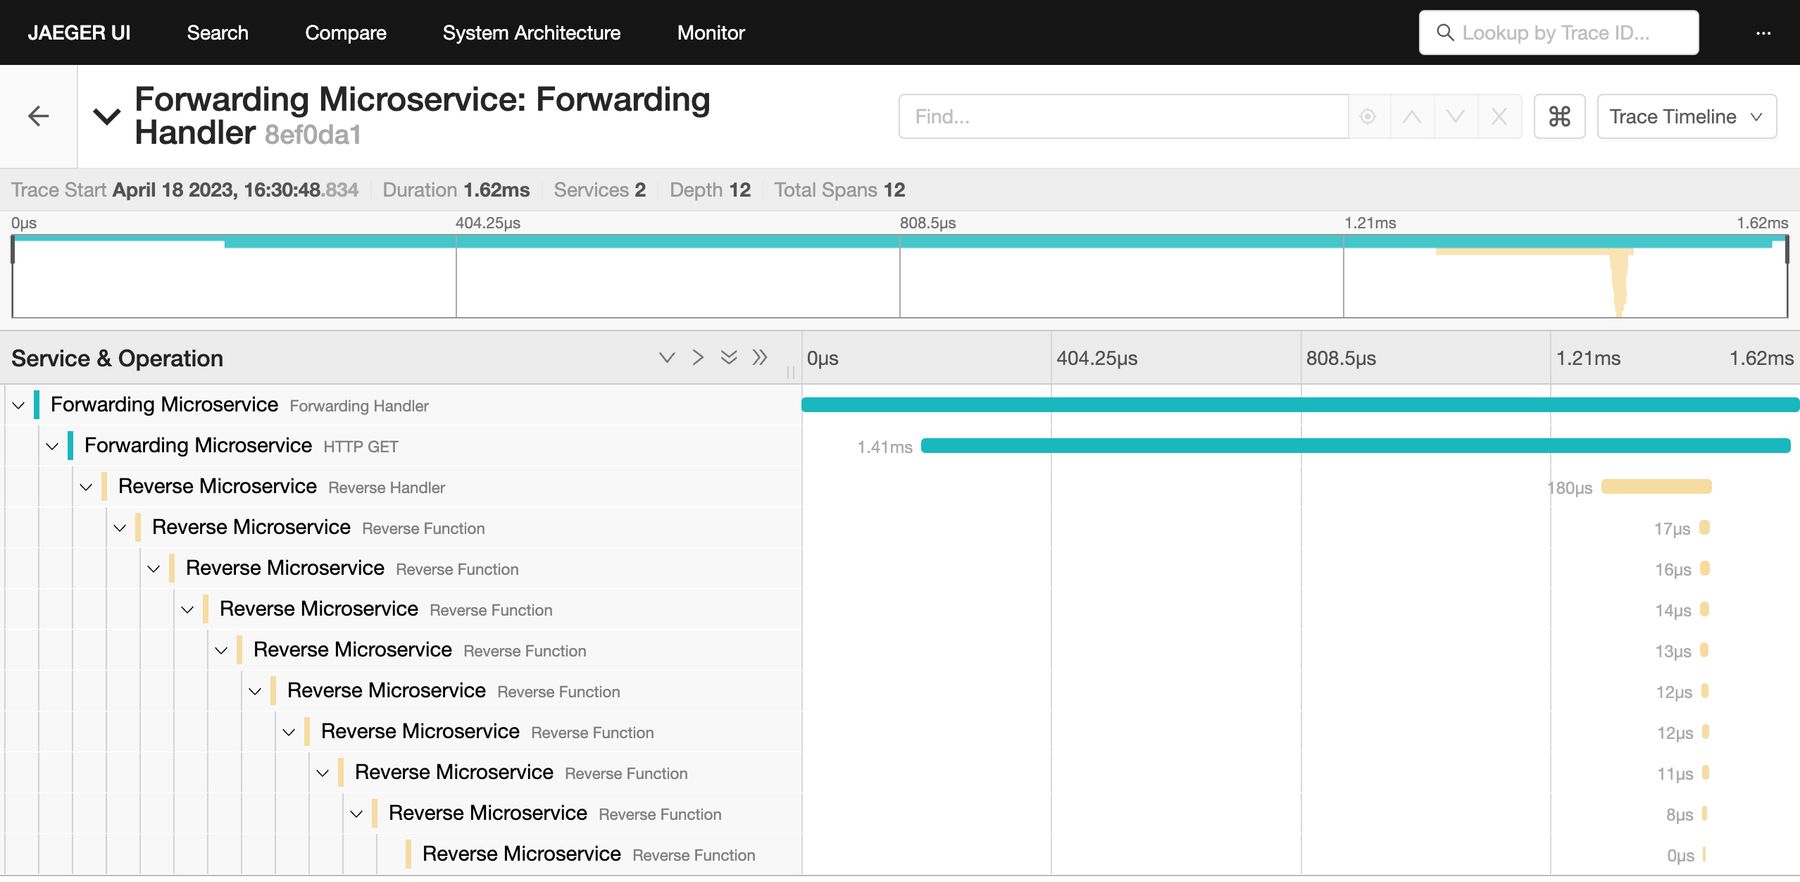
If we now go to the Jaeger UI, and search for the trace_id, which, in this case,
is 8ef0da10cfb0183cdf8fcbe89b778bf6, we will be able to find the exact request
we’ve done with all the steps along the way. Since we created a span inside a recursive
function, we can even see each iteration.
You can imagine how this can be useful while developing some service that makes requests across different packages and other services. In addition, this can be used by multiple applications in different programming languages. The sky ⛅️ is the limit now.
I really hope this article was interesting to you, and I also hope that you learned anything new. It’s been a nice time working on adding tracing to our services and I think it will make a difference since it’s now clearer where bottlenecks are.