
Attempt at Visualizing Eve Room (and Weather) Metrics in Grafana
Permalink
Some weeks ago, I sort of discovered this Grafana dashboard from a Hackerspace here in Eindhoven. Since then, I’ve been wanting to create such an “observability” dashboard for the microclimate inside my home, and also balcony. I already own quite a few temperature and air quality sensors, so it can’t be that hard - I thought.
It is important to mention that the sensors I have are from Eve Systems: an Eve Weather, which sits in my balcony, and two Eve Rooms, which are located in the bedroom and the living room. To note that one of the Eve Rooms is the older iteration that does not support Thread. I also have some Loxone stuff - not by choice -, which also gives me very interesting data, from energy consumption, to CO2 in the different rooms. However, that part is not the focus today. The focus today is on the Eve Rooms and Eve Weather.
The Eve Rooms and Eve Weather are purely HomeKit devices. As you’ve probably already guessed it, there is no way to take the data out of HomeKit directly. Eve has an app where I can download the data from the devices, but that needs to be manually done.
I wanted something in real time. Therefore, I thought: I have a Raspberry Pi. There must be something I can do with it. Indeed: I can actually just install Home Assistant. Home Assistant allows me to add HomeKit devices and then bridge them back to the HomeKit network. They will still show up in my Apple Home, and I will be able to get the data out of the devices, automatically.
Beforehand, I had to quickly order a network switch because of the lack of Ethernet ports in the place I want to put the Raspberry Pi, as well as two small Ethernet cables. They arrived the next day and that worked out well. I installed Raspberry Pi OS Lite, setup a few packages, installed Docker. Everything went relatively smoothly. I decided to use Docker for installing Home Assistant, Grafana, and also InfluxDB.
Setting Up The Containers
I’m using Docker Compose to manage my containers. I will not go into detail on how to install and configure each one of these things. However, I am sharing the Docker Compose file here just in case. Note that there are some variables coming out of a .env file:
version: '3'
services:
  homeassistant:
    restart: unless-stopped
    container_name: homeassistant
    image: "ghcr.io/home-assistant/home-assistant:stable"
    volumes:
      - homeassistant:/config
      - /etc/localtime:/etc/localtime:ro
      - /run/dbus:/run/dbus:ro
    network_mode: host
    privileged: true
  grafana:
    restart: unless-stopped
    container_name: grafana
    image: grafana/grafana:10.2.3
    ports:
      - '3000:3000'
    volumes:
      - grafana:/var/lib/grafana
  influxdb:
    restart: unless-stopped
    container_name: influxdb
    image: influxdb:2.6-alpine
    environment:
      DOCKER_INFLUXDB_INIT_MODE: setup
      DOCKER_INFLUXDB_INIT_USERNAME: ${USERNAME}
      DOCKER_INFLUXDB_INIT_PASSWORD: ${PASSWORD}
      DOCKER_INFLUXDB_INIT_ORG: ${ORG}
      DOCKER_INFLUXDB_INIT_BUCKET: ${BUCKET}
      DOCKER_INFLUXDB_INIT_ADMIN_TOKEN: ${ADMIN_TOKEN}
    volumes:
      - influxdbv2:/var/lib/influxdb2
    ports:
      - "8086:8086"
volumes:
  homeassistant:
  grafana:
  influxdbv2:
After starting it up, I logged in into InfluxDB, to make sure everything was okay and working. Then logged in into Grafana, changed the default password, connected to InfluxDB, and so on. And I also logged in into Home Assistant, where I connected all the Eve devices as per instruction.
Everything looked fine. I connected Home Assistant to InfluxDB and it started spitting out metrics. And this is where I noticed: the frequency at which I am getting metrics out of each sensor, as well as which metric is not… consistent. Not. at. all.
Looking at Grafana
The Eve Rooms provide temperature, relative humidity and air quality, while the Eve Weather provides the first two and also air pressure. I let everything run since 13h yesterday until now in order to gather more data and be certain if there are some problems or not. Let’s take a look.

On the dashboard, you can see all the data since the beginning of the experiment. You may have already noticed: some graphs look relatively normal, such as “Volatile Organic Compound Density” of the Living Room. It has a lot of data points. Others however, look extremely boxy.
I checked the data directly in Home Assistant, and the result is similar. From what I researched and could figure out, it seems that the sensors are simply not reporting the data frequently enough. I took a look at my old exported data from the sensors and it changes every at least every 10 minutes. And the values are always different. So I don’t see why they wouldn’t do it.
And another question for example: why does the Living Room report the air quality so often but rarely updates the temperature and humidity? Why do none of them report data in a consistent, regular, interval?
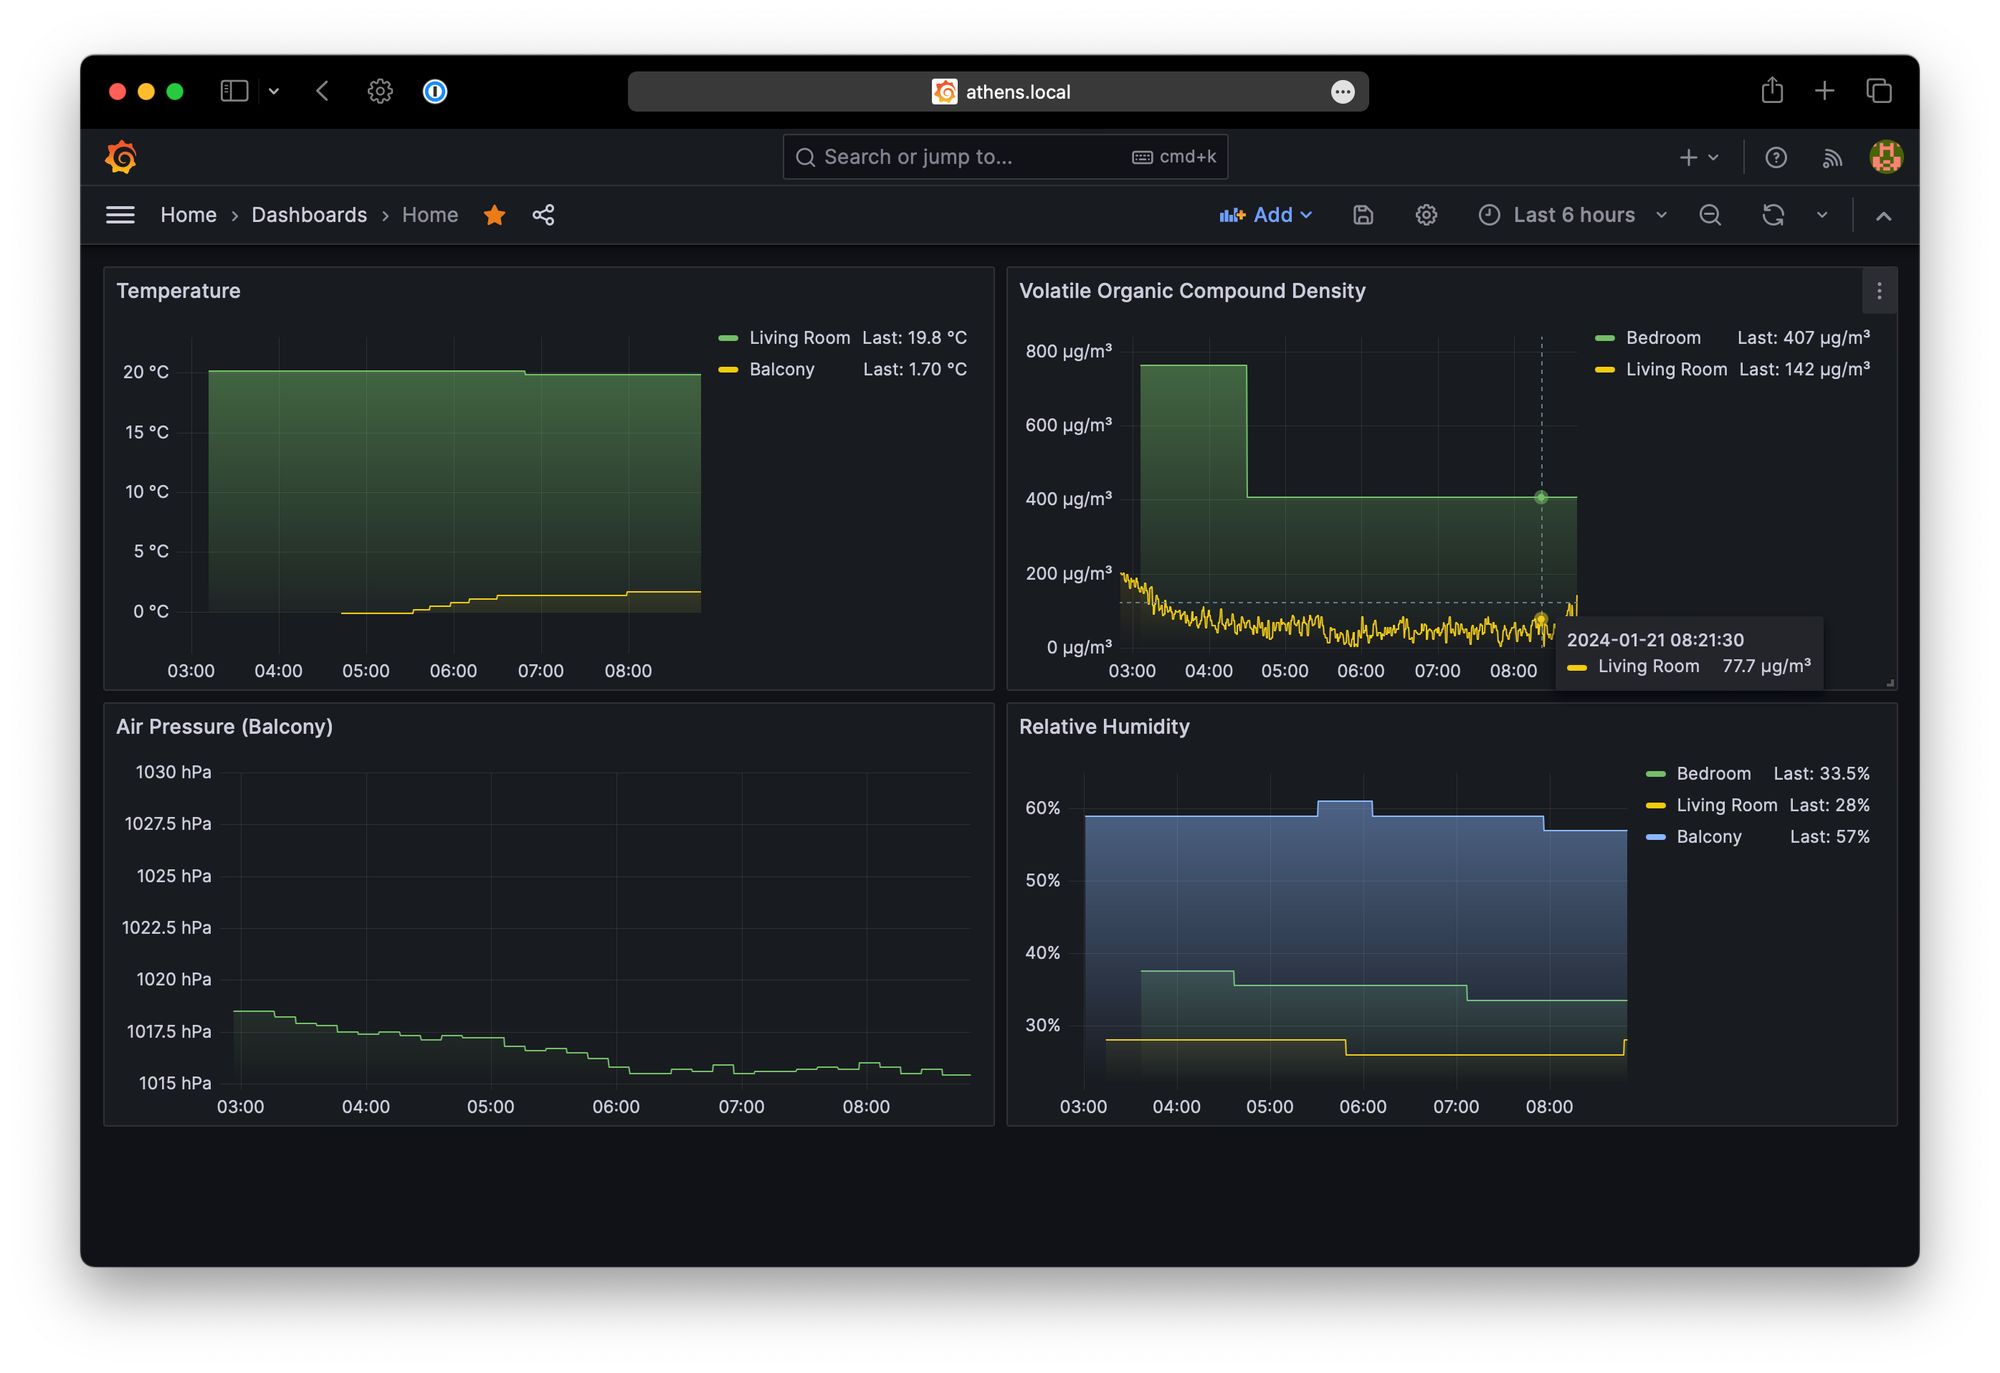
Looking at the screenshot above, the problem is more clear. In the last 6 hours there’s simply no temperature data from the bedroom, but the other metrics got updated. I really doubt the temperature in the balcony hasn’t changed even .01 during the whole night. I checked in Home Assistant: indeed the last metric for the temperature came on yesterday. I’m sorry, but that’s simply not correct. The display from the sensor even shows a different temperature!
What Now?
I honestly don’t know. I’ve searched on the Internet and the problem seems to most likely lie with the Eve products. However, I can’t find that much because, realistically, very very few people are using Home Assistant with these devices I would say. My goal with this was to have a real time feed of the sensor data. If that’s just not possible, I can’t do much about it.
One option is to simply download the data manually every month using their app and making a visualization out of it. Then I wouldn’t need my Raspberry Pi anymore 😅. The other idea would be to buy a different, hopefully more reliable, sensor just to see if the problem actually lies with the sensors.
Do you have any similar experience? Or even any sensor recommendation that I could try?